How do you know if your Special Teams units were “good” or “bad” last season? Or last week?
Usually, those questions are answered with something along the lines of “well, we only gave up one kickoff for a touchdown,” or “we felt we did pretty well, we didn’t give up any huge plays to lose games.”
But does that really encapsulate your Special Teams units in a manner that helps your program have the best units that it can? Does that fact that you only allowed one kickoff for a touchdown mean that your Special Teams are good? I would argue that this is lazy coaching, and an ineffective way to answer the question about the productivity of your Special Teams.
USING STATISTICAL ANALYSIS TO EVALUATE YOUR SPECIAL TEAMS
There is no better way to evaluate the effectiveness of your Special Teams than performing a statistical analysis of each of your units. This can be a time consuming effort, but there is not another way to get a true understanding of how effective your Special Teams units are.
For instance, the goal of the Kickoff team is to put your defense in the best position possible each and every time it touches the ball. To pin your opponent as close to their goal line as possible. So, the begging question is, how did they do this past season? And a better question to examine this idea even further, is to ask how your Kickoff unit did compared to your opponents?
The only way to answer these questions is by a statistical comparison. This means that you are using real world statistics to analyze the effectiveness of your units. One thing that I have found as I’ve consulted coaches at both the collegiate and high school levels regarding their Special Teams is that they do not take the time to stat them out like they do with offense and defense. And I understand that. Coaching takes a lot of time. The average start after Kickoffs is not printed in the newspaper on Saturday mornings. Outside of an individual stat like punt return averages or field goal percentages, the media never reports Special Teams statistics.
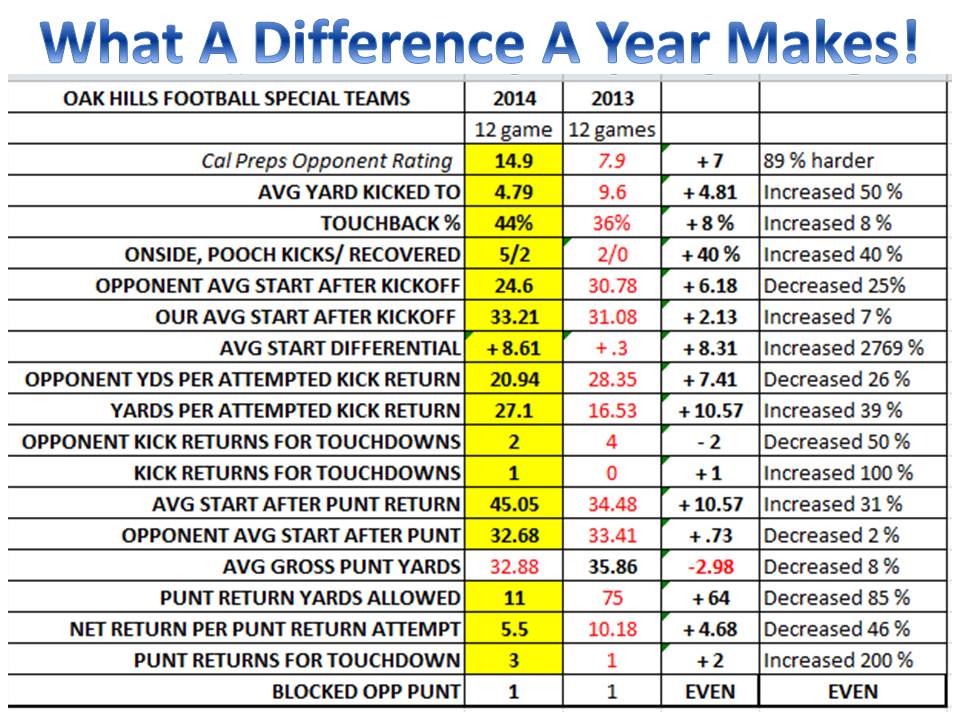
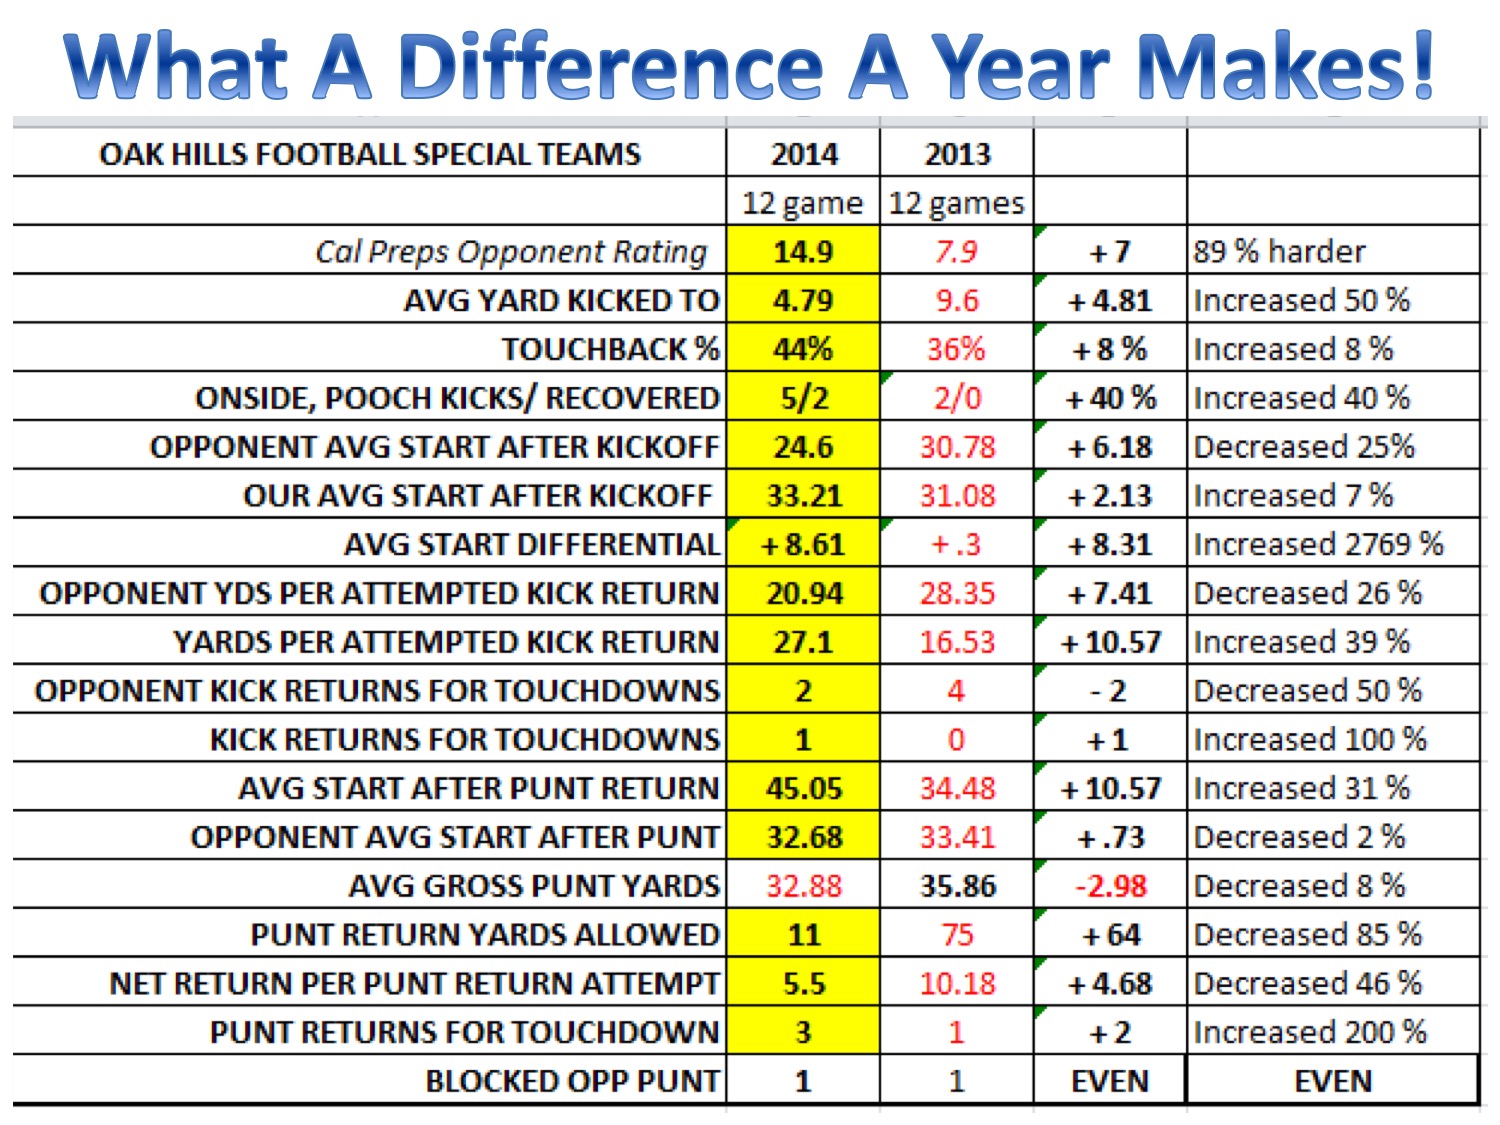
Using statistical analysis to evaluate your special teams means watching every kick of the season, or the past week’s game, and charting every kick. For instance, if your kickoff team kicked to the 9, 2, -2, 5, 3 and 4, then your averaged “Kicked To” is the 3.5 yard line. Let’s say your opponent brought those kicks to the 24, 29, 36, 17, 20, and 53; then your opponent’s average start is their own 29.83 yard line. This means that on average, your team allowed 26.33 yards per return since you kicked it to the 3.5 yard line. I believe that the most important stat for the Kickoff team is the opponent’s average start. Obviously, you want their average start to be worse than your average start.
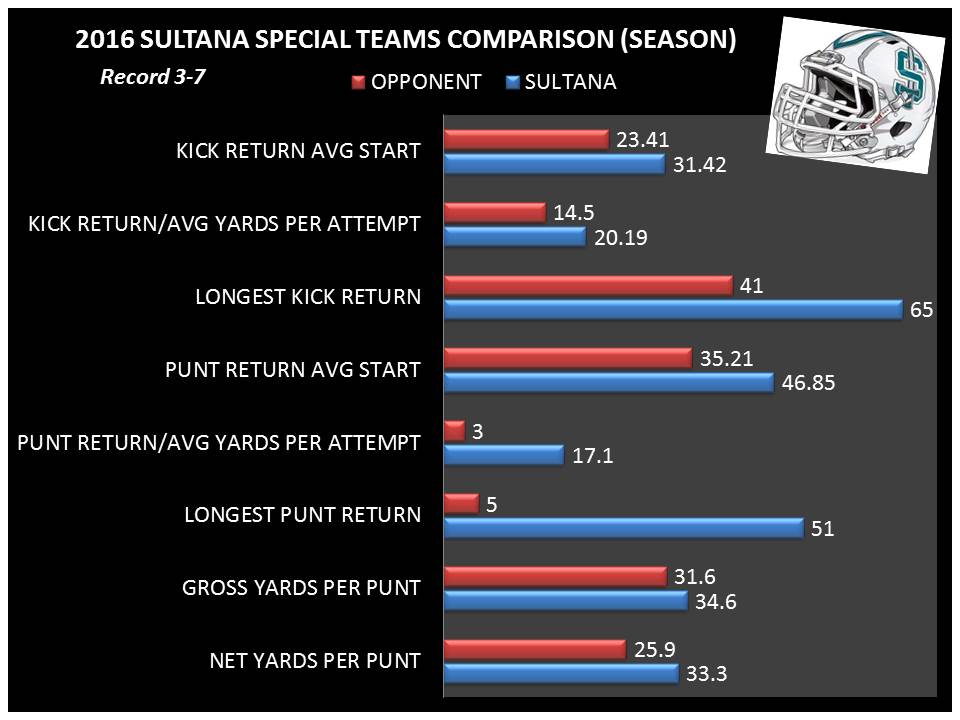
For example, at Sultana High School in 2016, our “Average Start After Kickoffs” was the 31.42 yard line; our “Opponent’s Average Start After Kickoffs” was the 23.41. This is an eight yard difference every single kick of the game. Multiply that by 7-9 kicks, and the yards start to pile up. Those hidden yards can mean the difference between winning and losing a football game.
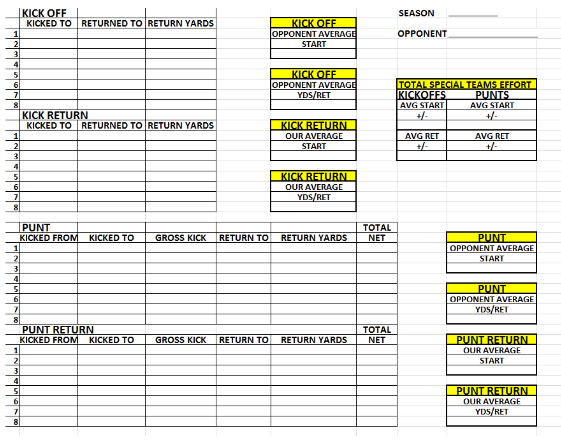
DEVELOPING YOUR STATISTICAL ANALYSIS ON A WEEKLY BASIS
Below is a chart that I use on a weekly basis. This type of organizational chart will save you and your staff a lot of time in trying to develop a system to evaluate your Special Teams statistically. I have done this a few different ways over the last thirteen years of being a Special Teams Coordinator. This is by far the best method I’ve used.
- We use Hudl, and can bring up every kickoff in just a matter of seconds after labeling the game.
- I will watch every kickoff, every punt, etc. from the game, and simply enter my data on this form. I have found that trying to evaluate my player’s efforts, while also inputting data can be distracting. So, I go through the film the first time, and just enter all of my data. This usually takes about thirty minutes at the most.
- Once the data has been entered, I can then find the averages. These averages go into the boxes on the right of each analysis in the document.
- I summarize all of this data in the box titled “Total Special Teams Effort.”
- We want to be in the “+” category for each of the units.
- I will review this document with our coaching staff at our meetings on Sunday evening.
ANALYZING YOUR STATISTICAL DATA ON A WEEKLY BASIS
Now comes the analytics. What story do your numbers tell? Do they reveal that your team is “winning” the Special Teams battle? Or do the numbers say that you are “losing” it? The statistical data is going to tell a story.
When I arrived at Sultana High School just before the 2015 season, the first thing I did was watch and chart every single kick of the 2014 season. I will use this same exact process to statistically analyze my new job as the Special Teams Coordinator at Victor Valley College.
I found that they allowed a total of 253 Punt Return yards. This is a lot of yardage. So, I had to analyze why they were allowing so many yards, this analyzation happens on film. I determined it was two reasons: their scheme and their poor tackling. So, we changed the scheme to the Shield Punt, a system I’ve used since 2002. This past season (2016) was my best season ever with the Shield Punt. We allowed just SIX yards of Punt Return yardage! In my first season here (2015), after changing from the Pro Style to the Shield, we allowed just 28 yards. So, we cut the return yardage by a whopping 89% in our first year, and 98% in two years. I love those stats! That is stealing a lot of yards back from our opponent every single time we punt.
One of the most important stats to evaluate weekly is your Punt Return Yards Per Attempt. This will help you understand if your return scheme is working effectively or not. How many yards are you able to steal every time the opponent punts? Before our staff got here to Sultana, they averaged 7.25 yards per attempt. Again, I analyzed what they were doing by watching every kick of the year. And I learned that, for the most part, the kids simply were not blocking anybody effectively. They mainly used zone returns. I’m a big fan of man return schemes because of the accountability that each player has. If he misses blocking his man, everyone knows it. We spent a lot of time on our return game, and it paid dividends. In 2016, our Punt Return Yards Per Attempt was 17.1 yards, a 135% increase. That’s almost two whole first downs every time we returned the football!
So, having the data is not enough. It is the actual analyzation of the data that will improve your Special Teams play. Make sure that your staff and your players see this data on a football field. This will help the statistical analysis come to life. In the Spring I literally put a kid on the yard line where we had averaged our offense starts the previous year. Then I put another kid where our opponent started on after an average Kick Return of theirs. This made things very real to the players. I also showed them the difference in our Punt Return yardage vs. our opponent’s yardage.
Another idea is to put this on a power point. Create a football field, and put your logo where your average start after kickoffs is, and where your opponent’s average start after kickoffs is. Do this for each of the categories. Again, it will help to open the eyes of your players, as they will see how the black and white numbers really relate to football in a real way.
MOTIVATE THE TROOPS WITH STATISTICAL COMPARISON
Below you’ll find a graphic comparing some of the key Special Teams categories and how we measured up against our opponents for the 2016 seasons. I would use this exact same graphic on a weekly basis to help motivate our kids. We didn’t lose many of the battles this year Special Teams wise, and I think one reason is because of the time I spent doing this statistical analysis, and sharing it with our players and staff. They loved seeing that we dominated our opponents in the area of Special Teams. You’ll see in the graphic below that we won all 8 of these categories. There are nineteen categories I track, and we won seventeen of them this year! But these eight are the major ones in my opinion.
Putting this information before your kids on a weekly basis should help to convince them that their work on the field is being noticed, that it matters and that the Friday night results validate their hard work Monday-Thursday. Sometimes, Special Teams gets lost in the shuffle. This is one way to prevent that from happening.
Chris Fore has his Masters degree in Athletic Administration, is a Certified Athletic Administrator and currently works as a Principal in Southern California (yes, he went to the “dark side” after 17 years of coaching!) He served as the President of the California Coaches Association for 3 years. Fore is the CEO of Eight Laces Consulting which specializes in helping coaches nationwide in their job search process. Fore has been named to the Hudl Top 100 Coaches, and the Top 5 Best High School Football Coaches to follow on Twitter by MaxPreps. Follow him!